A useful spreadsheet service helps someone make a decision from information they can trust. The work begins before the chart: understand the question, inspect the data, define the rules, calculate carefully and explain the limits. A colourful dashboard built on duplicates or ambiguous fields can be less useful than a plain table with a clear audit trail.

In this guide
This route is part of which digital skill should I learn. The worked example uses six invented order rows and asks one narrow question: what is the value of valid, complete orders by region? It is a data-quality and arithmetic exercise, not a real business report or a claim about recognised accounting revenue.
Learn the habits that protect the analysis
Be comfortable with files, folders, CSV imports and basic formulas. The guide to computer basics for digital skills covers preparation. Keep an untouched copy of the input and create a separate working version. Record the file date, source, field definitions and question you are trying to answer.
Learn sorting, filtering, relative and absolute references, data types and simple conditional calculations. Understand the difference between a blank, zero and text that looks like a number. When a column contains dates, decide which date convention applies before converting it. Keep identifiers as identifiers; a leading zero may be meaningful.
Then learn summaries and presentation. A total should have a defined population, period, unit and inclusion rule. A chart should make the comparison clearer, use a suitable scale and name its source. More advanced analytics, statistical inference and machine-learning systems are further specialisations, not automatic extensions of a spreadsheet cleanup service.
Define the question before cleaning
The fictional file has an order ID, quantity, region, status and unit price in USD. The rule is to keep one row per order ID, investigate duplicate conflicts, exclude records with missing required numeric inputs, and summarise only orders marked Complete. Pending orders remain available in the clean working data but do not enter this specific total.
| Order | Quantity | Region | Status | Unit price, USD | Issue |
|---|---|---|---|---|---|
| O101 | 2 | North | Complete | 30 | None |
| O102 | 1 | North | Complete | 40 | None |
| O102 | 1 | North | Complete | 40 | Exact duplicate |
| O103 | 3 | South | Complete | 20 | None |
| O104 | 2 | South | Pending | 25 | Valid record; outside this total |
| O105 | Missing | North | Complete | 15 | Quantity requires review |
Removing an exact duplicate is different from choosing between conflicting records. If the two O102 rows had different prices, do not arbitrarily keep whichever appears first. Ask which source is authoritative and record the resolution. Missing quantity is also different from zero quantity; turning it into zero would conceal uncertainty.
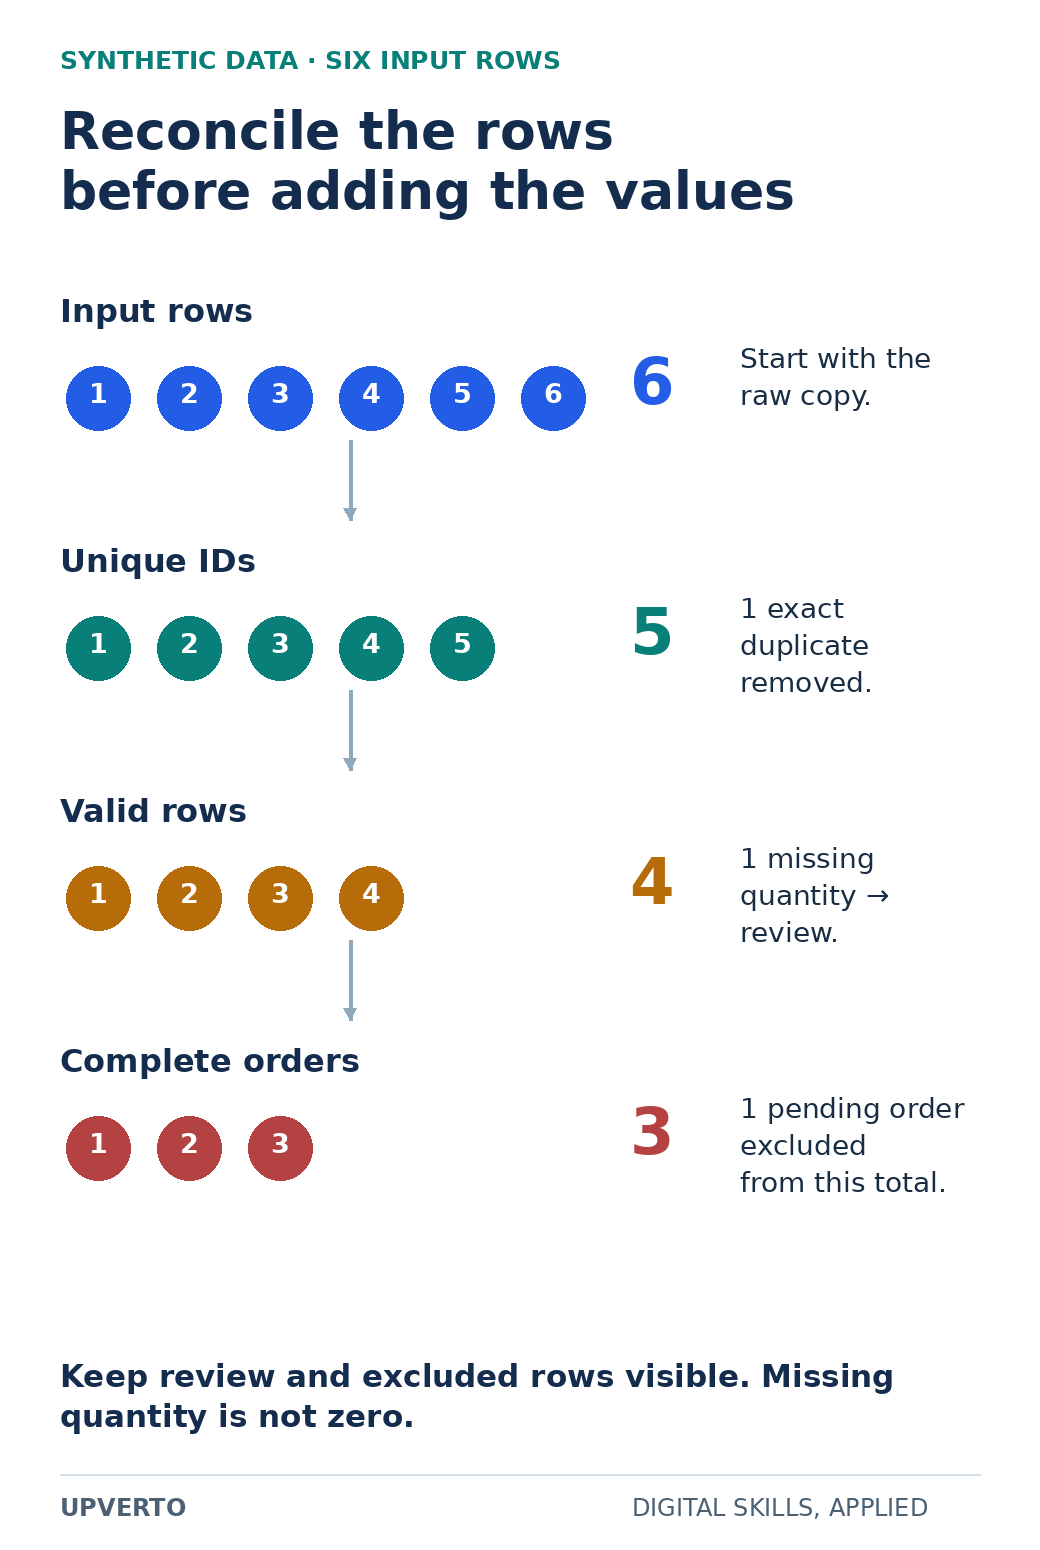
Read the text version: Reconcile raw, unique, valid and included rows
Six synthetic input rows contain one exact duplicate, leaving five unique IDs. One ID has a missing quantity and moves to review, leaving four valid rows. One valid row is pending, so the complete-order summary includes three orders. Preserve the raw, review and excluded records; missing quantity is not zero.
Calculate and reconcile the result
After removing one exact duplicate, five unique order IDs remain. Move O105 to a review table because its quantity is missing. Four valid rows remain in the working table. O104 is Pending, so the reporting rule includes three complete orders: O101, O102 and O103.
Their values are 2 × 30 = USD 60, 1 × 40 = USD 40 and 3 × 20 = USD 60. North totals USD 100 and South totals USD 60, for USD 160 overall. O104’s USD 50 is excluded by the status rule. O105 has no calculated value until its quantity is resolved. The companion arithmetic check reproduces these counts and totals from the synthetic rows.
In the four-row clean table, use columns A–F for order ID, quantity, region, status, unit price and order value. In F2, multiply B2 by E2 and fill down through F5. A regional total can use:
=SUMIFS(F2:F5,C2:C5,"North",D2:D5,"Complete")Microsoft’s SUMIFS documentation defines how multiple criteria select values for addition. Its SUMIFS error guidance also explains the need for matching range dimensions. Check the selected rows yourself before relying on the formula. The formula is useful only because the table’s inclusion and cleaning rules are already explicit.
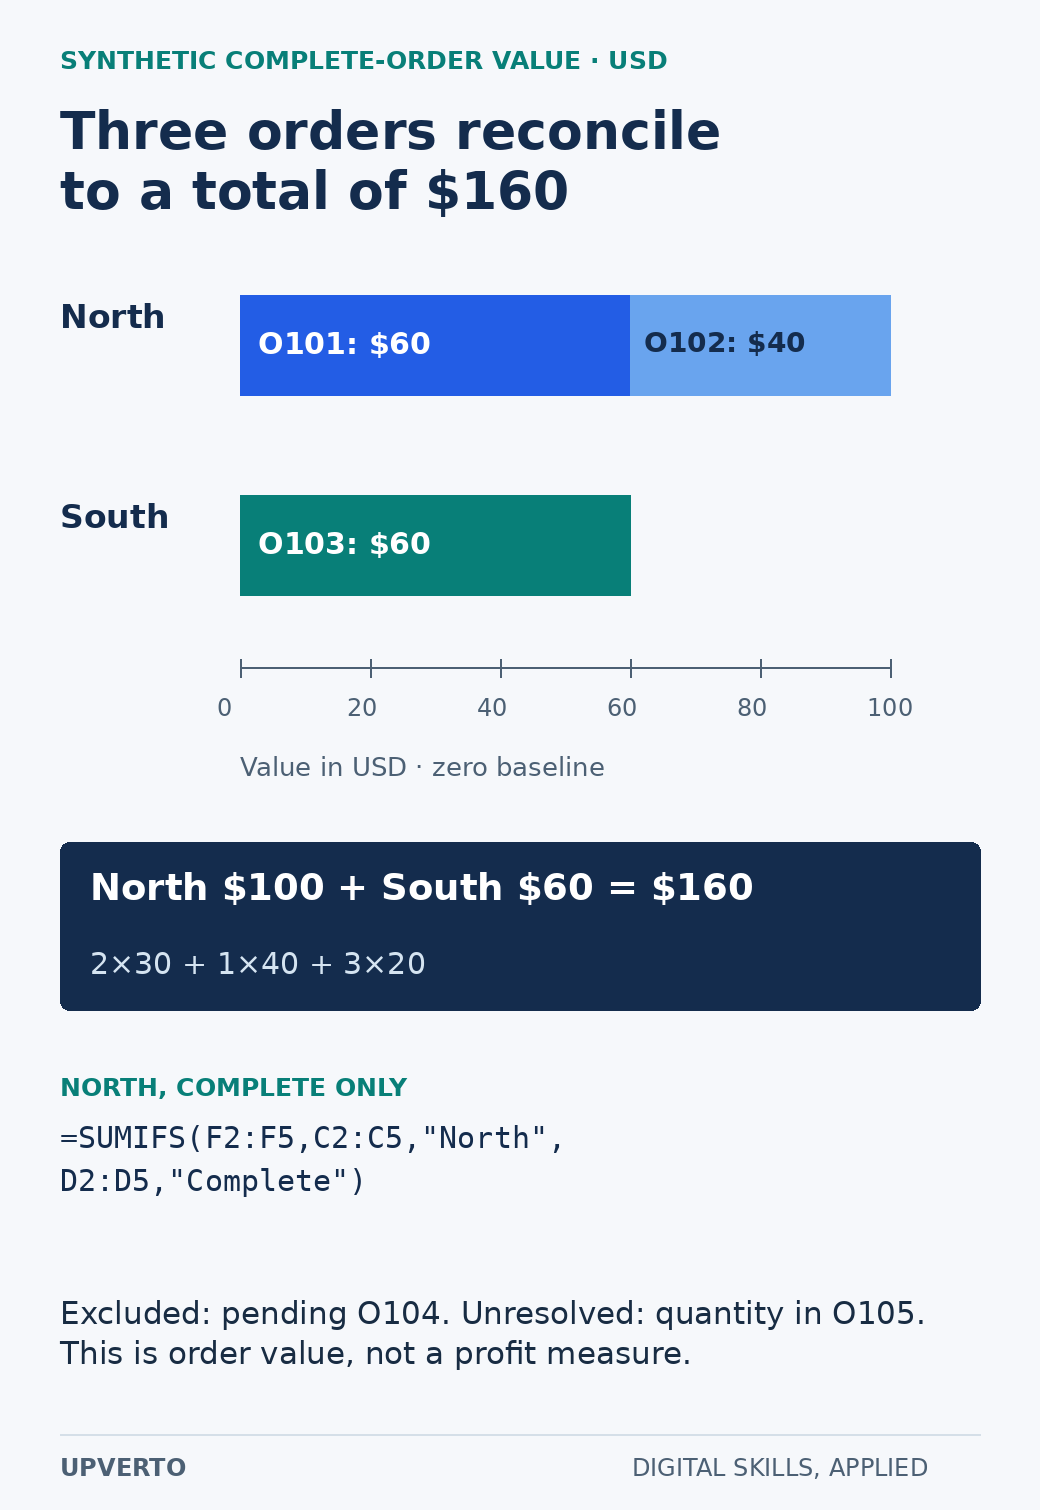
Read the text version: Reconcile a regional total with its contributing orders
North contains O101:2×USD 30=USD 60 and O102:1×USD 40=USD 40, totalling USD 100. South contains O103:3×USD 20=USD 60. Overall complete-order value is USD 160. O104 is pending and excluded; O105 has a missing quantity. In the four-row clean table, =SUMIFS(F2:F5,C2:C5,"North",D2:D5,"Complete") returns 100. This is synthetic order value, not profit or recognised revenue.
Present a decision-sized report
A suitable report title is “Synthetic complete-order value by region.” Under it, state that the sample contains three included orders, values are in USD, and the total excludes one pending order and one unresolved quantity. A two-bar chart can show North at 100 and South at 60, with a zero baseline and labelled values.
Do not call North the more profitable region. The sample contains no cost data, and the small invented set is not evidence of real regional demand. Do not call the values revenue without confirming the business’s accounting definition. Name the measure you actually calculated.
Include a short data-quality note beside the result. The reader should not have to open a separate technical file to discover that a record was excluded. If resolving O105 could materially change a decision, say that the report is provisional and identify the required input.
Use a cleanup and dashboard brief
Copy these fields into your next exercise: business question; input source and date; field dictionary; unique key; allowed values; missing-data rule; duplicate rule; calculation definitions; exclusions; intended reader; and checks. Add a change log with original value, new value, reason and reviewer.
- Reconcile input row count with duplicates, review rows and retained rows.
- Check one calculation manually and compare the regional sum with the overall total.
- Change one valid input deliberately and confirm which result should change.
- Test a blank, unexpected status and conflicting duplicate without silently coercing them.
- Review formulas after adding a row; make sure the relevant range expands as intended.
- Explain the report to someone who did not build it and note any ambiguous label.
Keep the raw synthetic CSV, cleaned table, review table, formulas and report together. A reader can then inspect your reasoning rather than trusting a screenshot. When you write the portfolio narrative, use write a portfolio case study to distinguish the checked outputs from any broader interpretation.
Turn the skill into a bounded service
A first service might clean a permitted spreadsheet under agreed rules and deliver a summary with a quality log. Another might rebuild an existing report using documented formulas. Ask who owns the data, what it contains, who can access it and which decisions depend on the output. Confidential data needs appropriate handling; use synthetic data for public samples.
State the file formats, row or complexity assumptions, review process, update frequency and exclusions. A one-time cleanup does not include indefinite correction of future imports. A dashboard does not include forecasting or statistical claims unless separately specified and supported. Use create freelance service packages to describe the output and handover clearly.
Frequently asked questions
Should I learn charts before formulas?
Learn enough of both to complete a small question, but establish data definitions and calculation checks first. A chart makes a measure easier to see; it does not correct a duplicate, missing value or wrong formula.
Can I delete every duplicate row automatically?
Only under an agreed rule. An exact repeated record may be removable, but two rows sharing an ID can contain a correction or a conflict. Preserve the raw input and investigate differences before deciding what to keep.
Why not replace the missing quantity with zero?
Zero is a value; missing means the value is unknown. Substituting zero would create an unsupported order value. In the example, O105 remains in a review table until the required information is resolved.
Does SUMIFS validate the source data?
No. It adds values that meet the specified criteria. You still need to check types, duplicate rules, missing inputs and the intended range. A formula can calculate accurately from data that answers the wrong question.
Can I describe the sample total as business revenue?
The exercise calculates order value under stated rules. Recognised revenue may follow a different business or accounting definition. Use the precise measure available and avoid adding profitability or demand conclusions without evidence.
What makes a spreadsheet sample useful in a portfolio?
Include the question, synthetic input, cleaning decisions, formulas, checks and a readable result with limitations. That lets someone inspect your work and understand what you would hand over, beyond the appearance of a dashboard.